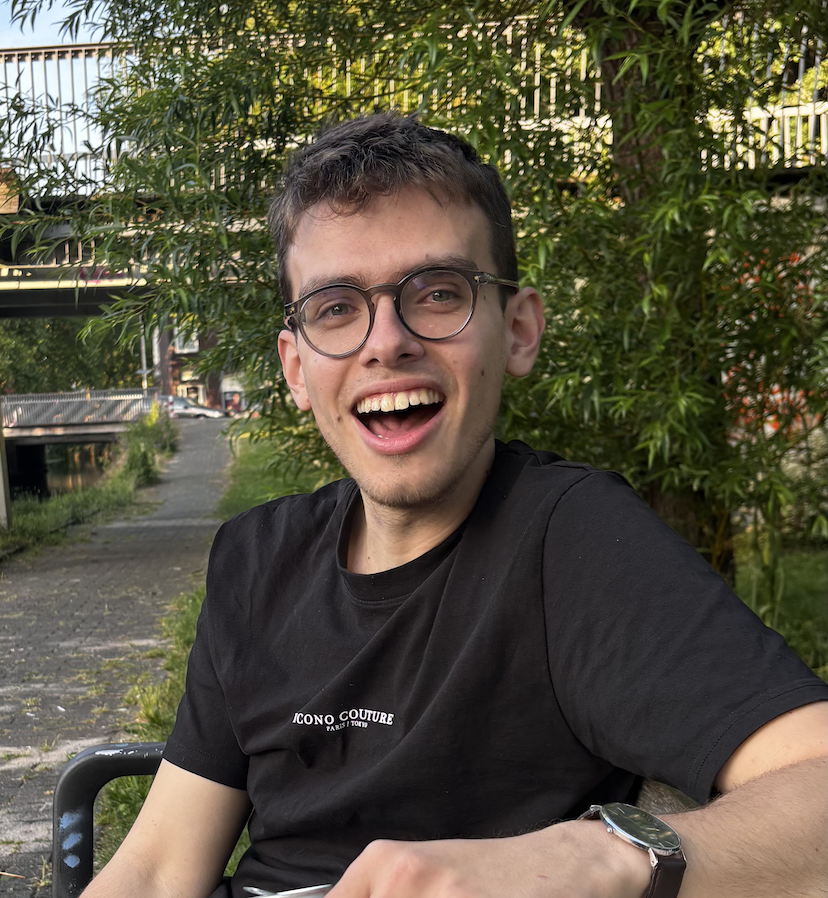
Hi, I am Aris and I study MSc in Human-Computer Interaction
Approaching human-centered design with an analytical, data-driven mindset
My Story
How it started
I've always been curious about how things work, technology felt like magic to me, and wondering about what is underneath is something that never stopped being exciting.
That curiosity pulled me toward math and Computer Science. I got my Bachelor's in Computer Science and Engineering and I spent then I spent 1.5 years working as a software developer. But the more I built, the more I realized my curiosity wasn't just about the technology, it was also about the people using it.
How it is going
That realization is what led me to Utrecht, to pursue a master's in Human-Computer Interaction. I wanted to keep the analytical thinking I'd built as a developer, but point it at a different question: not just how to build something well, but how to build something that actually serves the people using it.
Studying HCI lets me combine both sides of how I think, bringing the same rigor I apply to code and data to understanding people, and using that to design solutions that put human needs first.
My aspirations
I envision myself as someone who can design and build digital products that put human needs first — and this master's is my path there.
Along the way, I'm deliberately sharpening my data-oriented skills too, through electives in research methods and statistical analysis, so I can back up design decisions with evidence, not just intuition.
Projects
Mouse Interaction Experiment
Mouse clicking task

Mouse dragging task
This project taught me how to run a real longitudinal experiment end-to-end: designing tasks around an established theory (Fitts' Law), collecting weeks of behavioral data from real participants, and analyzing it with linear mixed-effects models rather than a single-session comparison. It also showed me how much noise remote, real-world data collection introduces, and how to design an analysis that's still robust to that.
Key Learning: Longitudinal experiment design, Fitts' Law-based task design, Svelte, statistical analysis with linear mixed-effects models in Python.
Adaptive Recipe Recommender System
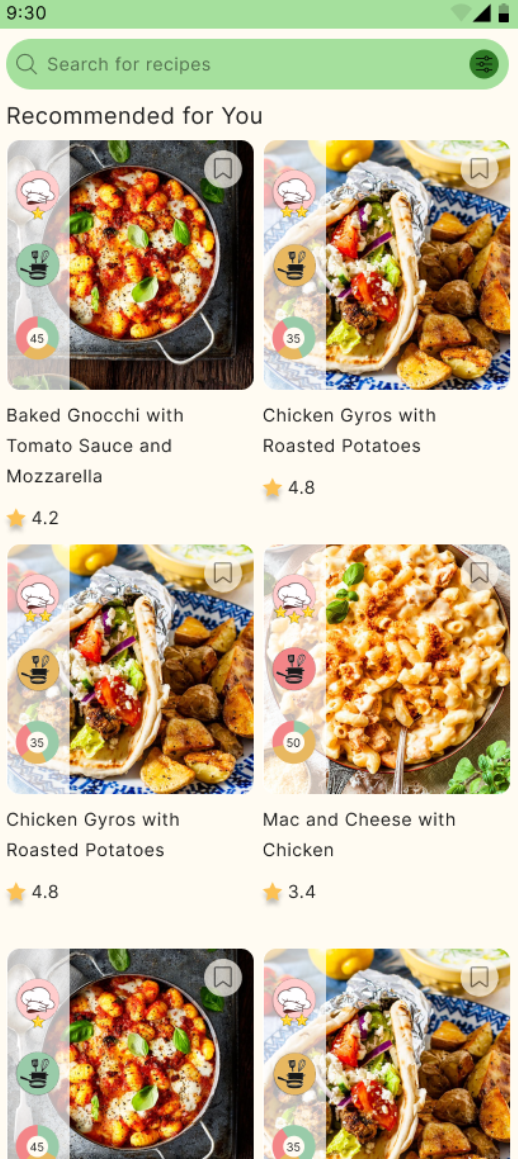
Carousel Layout of Recipes
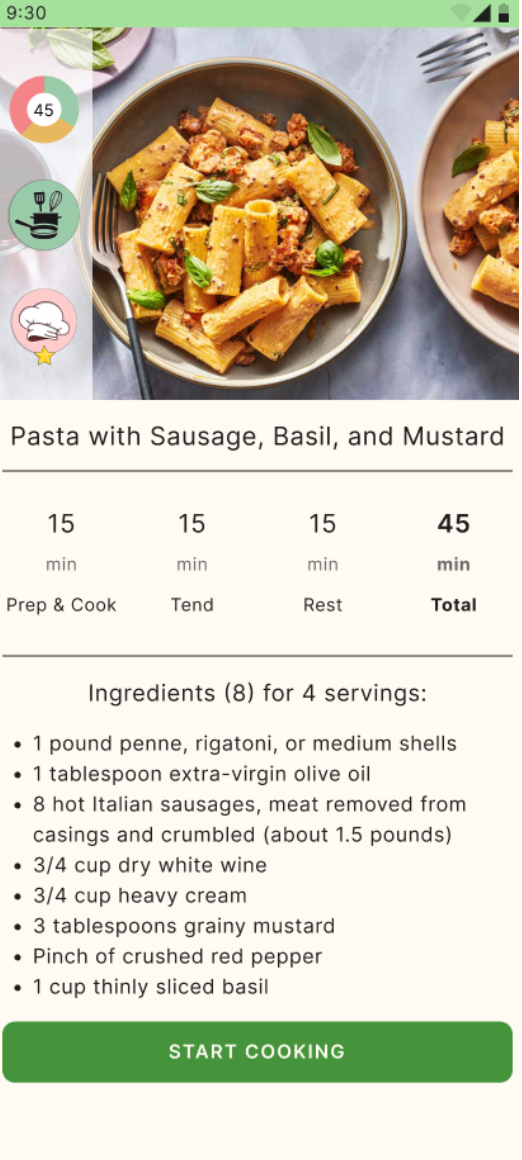
Recommended Recipe Card Design with badges
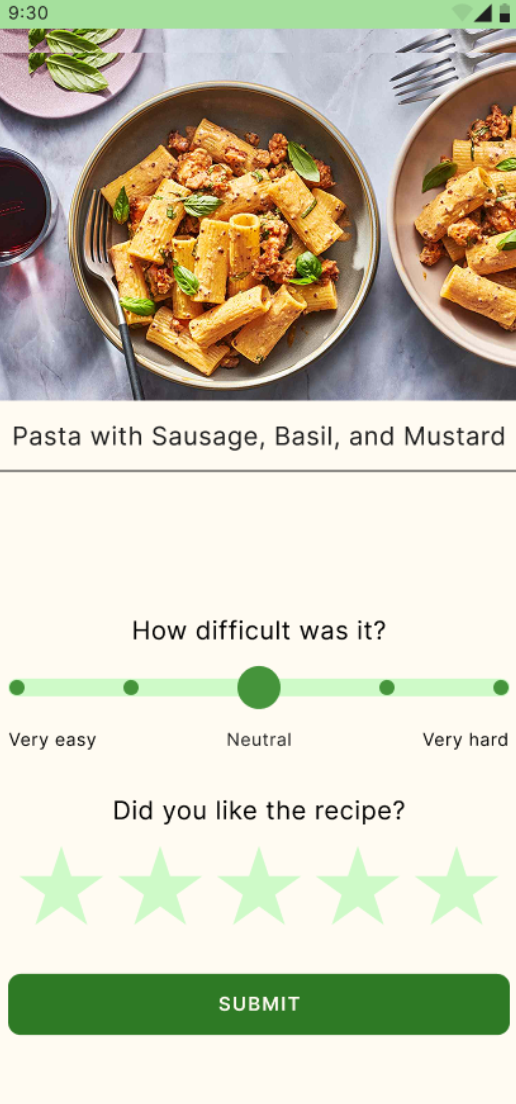
Completion Recipe Screen
This project taught me how to translate an abstract research question into a concrete, testable system design — defining specific metrics, justifying algorithmic choices like a weighted content-based/collaborative-filtering blend, and structuring an evaluation across separate layers (data, interpretation, algorithm, whole system) instead of testing everything at once. Incorporating peer and lecturer feedback also pushed us to simplify the design more than once, for example replacing a cluttered multi-carousel overview with a single scrollable list.
Key Learning: Adaptive system design, hybrid recommender algorithms, layered evaluation methodology, UI design for reducing cognitive load.
Data Visualization Methods
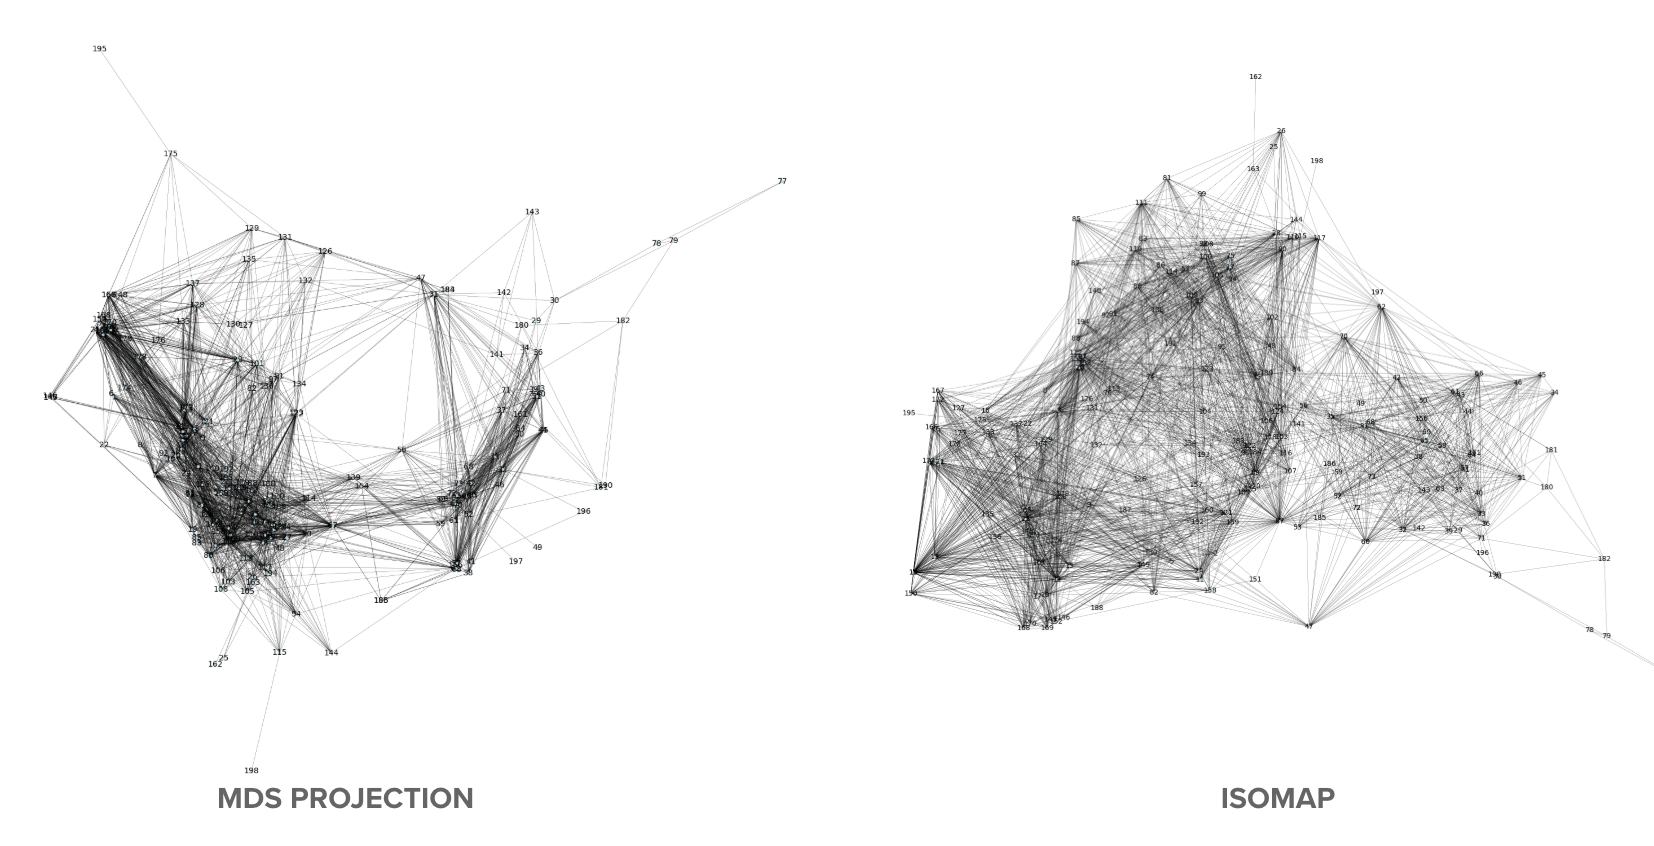
ISOMAP vs. MDS projections of the same graph
This project taught me how many different ways there are to represent the same graph, and how the 'right' choice depends entirely on the structure and density of the data — a lesson that only became clear by implementing the algorithms myself rather than calling a library function. Translating academic papers (Fruchterman-Reingold, the Sugiyama framework, force-directed edge bundling) into working code also deepened my understanding of algorithmic complexity and the tradeoffs between visual clarity, computational cost, and correctness.
Key Learning: Graph drawing algorithms (force-directed, hierarchical/Sugiyama, MDS/ISOMAP), Python (NetworkX, Matplotlib), algorithmic complexity analysis, data visualization design principles.
Side Projects
Table Tennis Student Association Website Redesign
Table tennis has been my hobby since childhood, I used to play competitively before stepping away during my bachelor's. When I moved to Utrecht for my master's, I found the University Table Tennis Association (UST) and got to play again. Being part of UST also gave me the chance to put my computer science background to use: I redesigned the UST website, first mocking it up in Figma and then building it in WordPress together with a friend, so future members could manage it themselves.
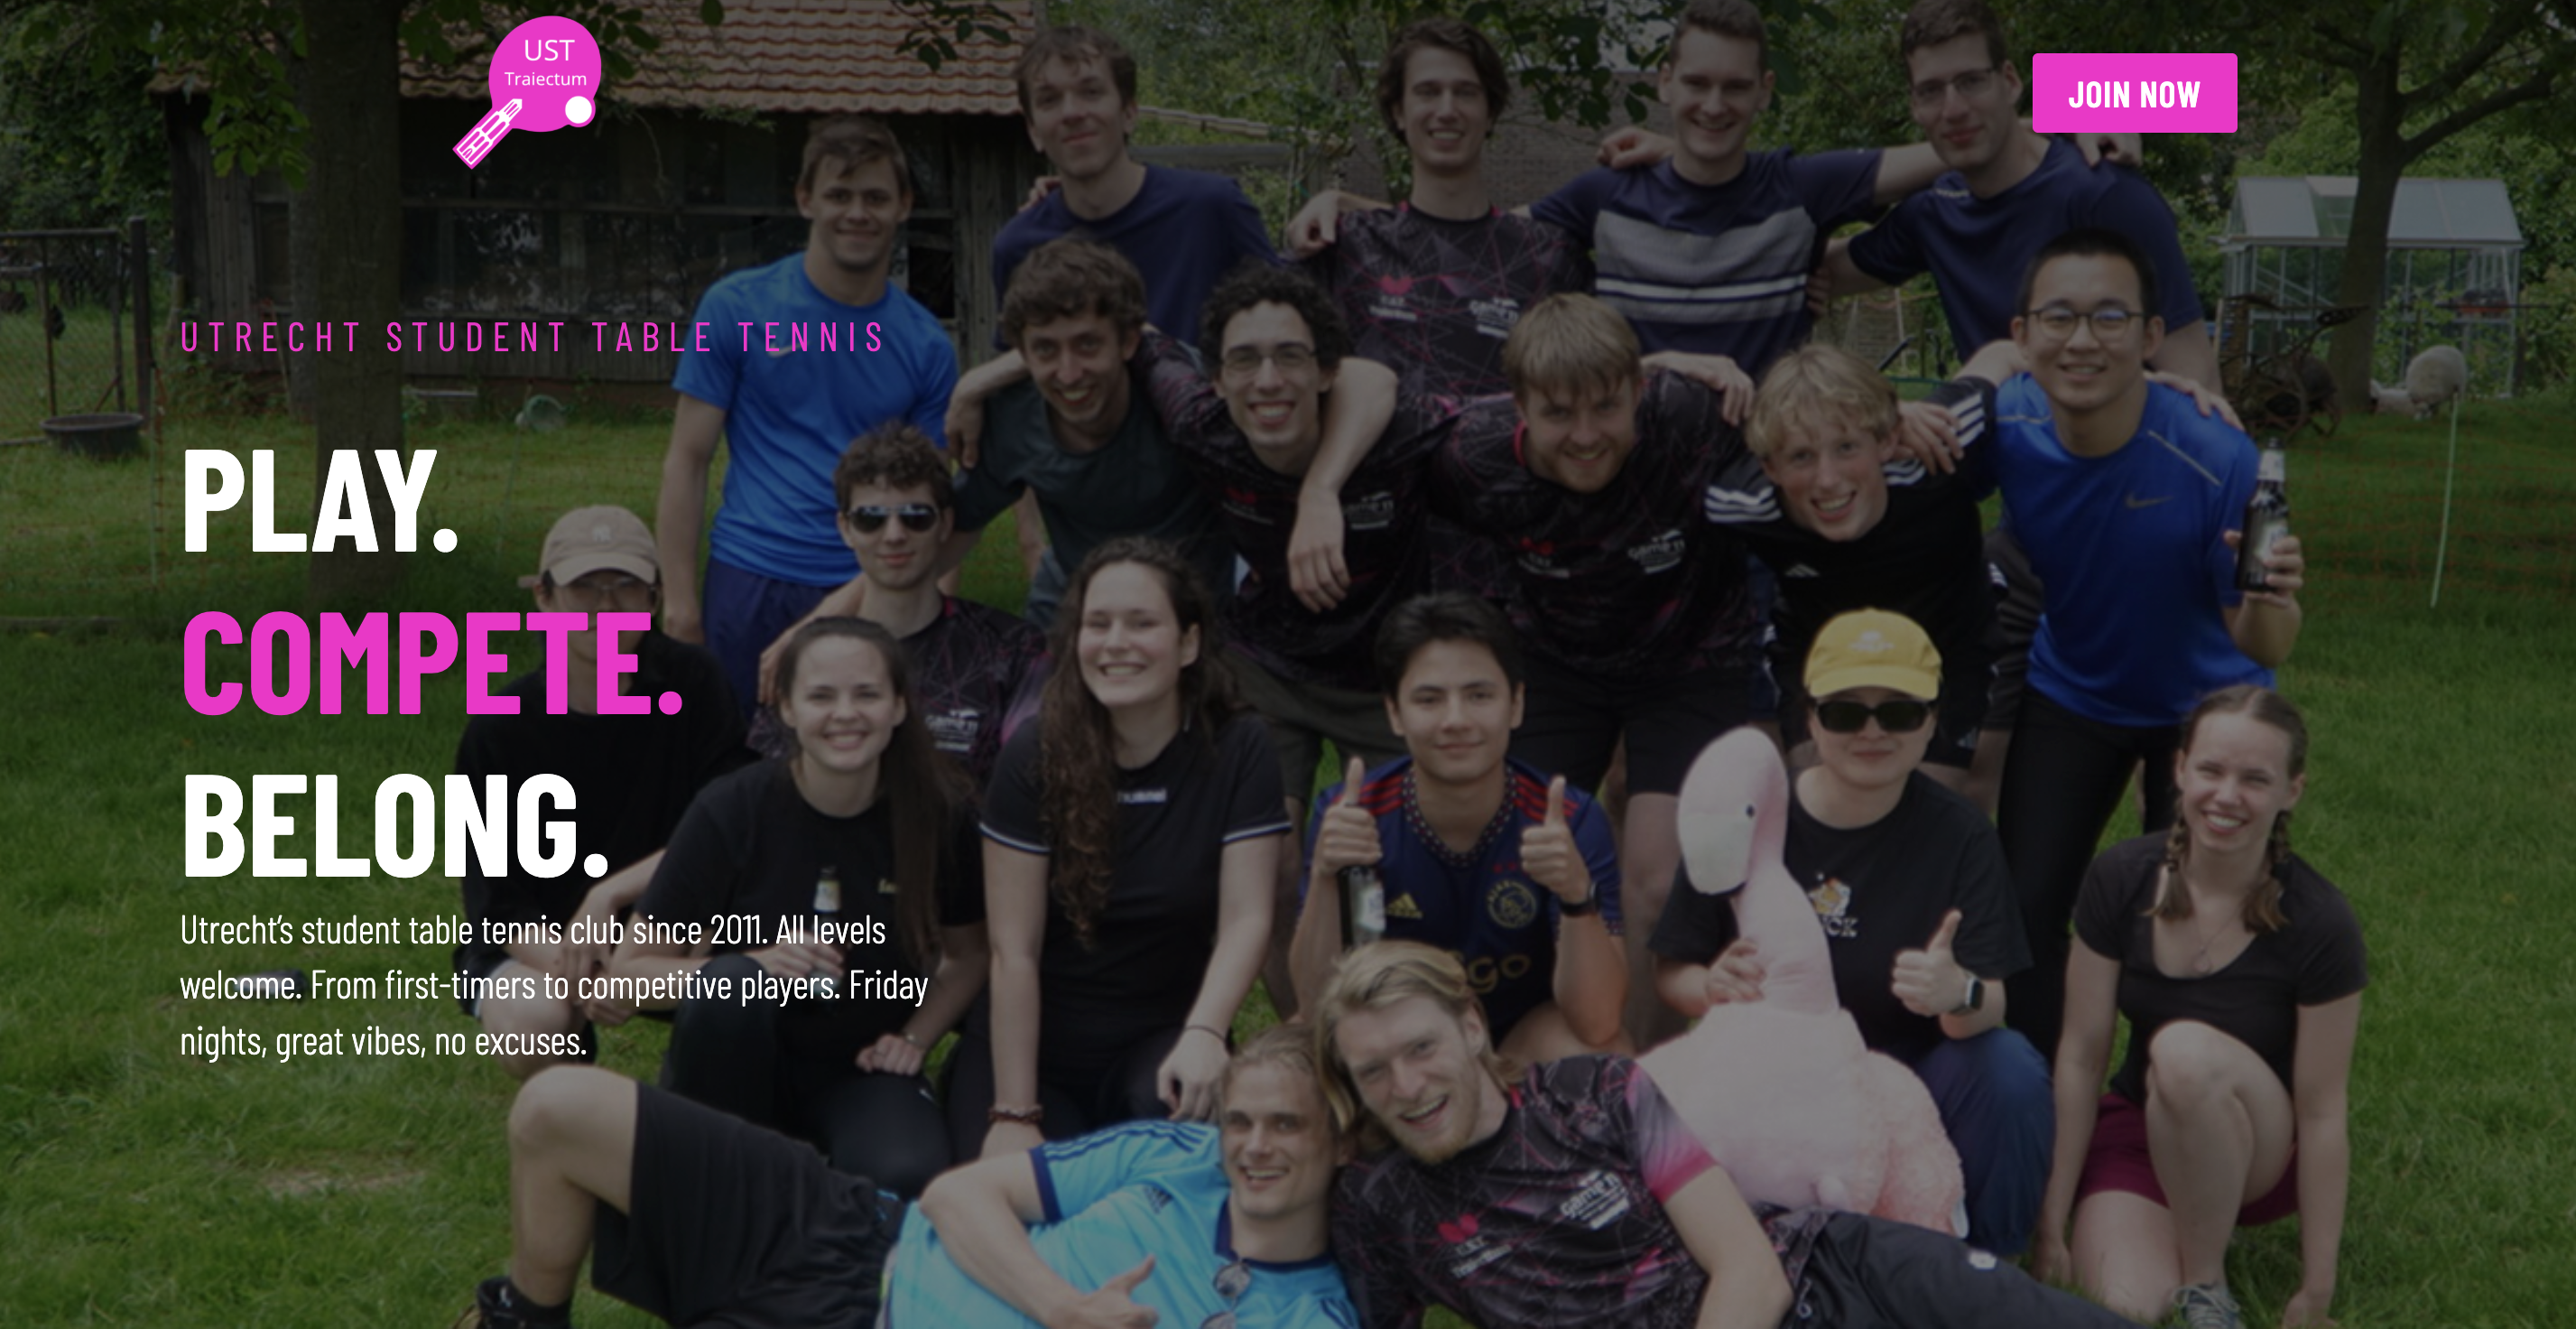
Website redesign mockup
Key Learning: Figma, WordPress, Web Design
Visit UST Site →Ferdinandos Hair Product Website
Ferdinandos, the owner of a barbershop in my hometown of Ioannina, asked me to help launch a premium hair product he's developing. I'm currently designing and building the e-commerce website for it: I started by designing the full experience in Figma, and I'm now implementing it in Next.js and TypeScript as an online store where customers across Greece can purchase and have the product shipped to them. It's a chance to take a real client's product from design concept to a production-ready storefront, end to end.
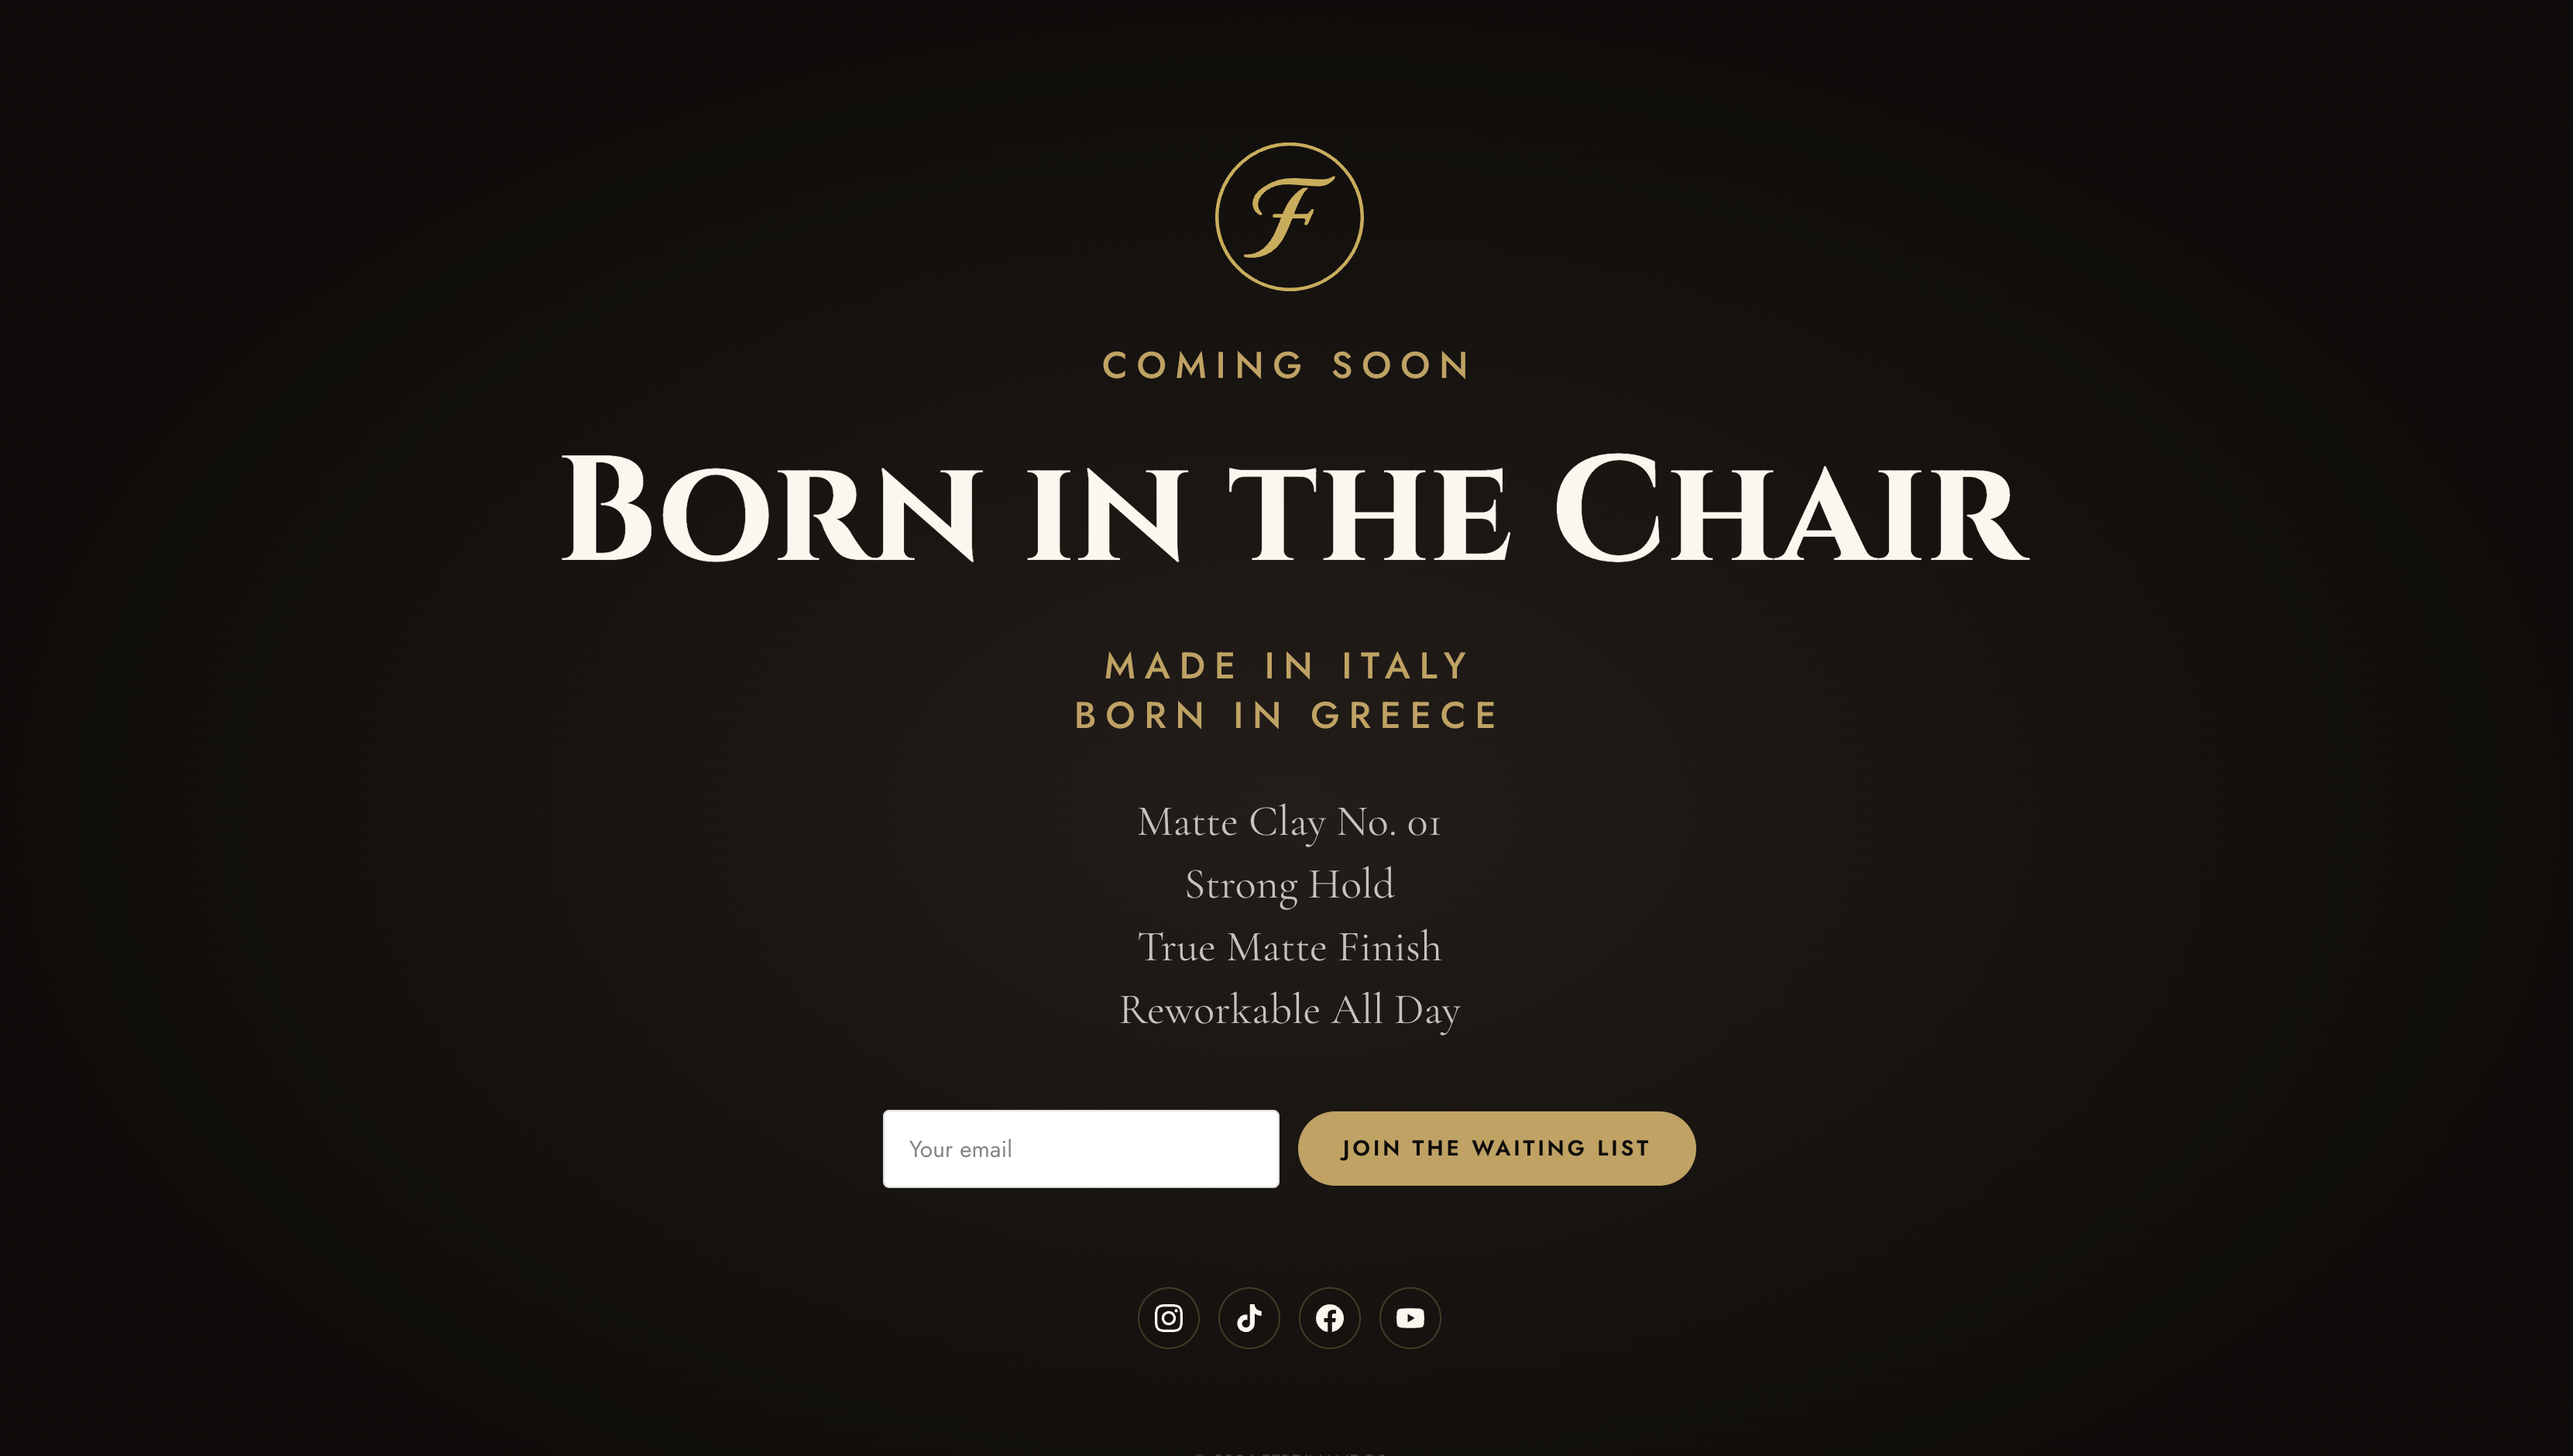
Coming Soon Landing Page
Key Learning: Figma, Next.js, TypeScript, E-commerce Web Design
Visit Ferdinandos Site →Study Plan
Goals
I didn't start this master's with a course-by-course plan. Being a developer felt limiting: I was shipping features, but I wanted to understand the humans those features were built for. I've always liked considering human needs when creating something, and I enjoy researching what people actually want and understanding their behavior. At the same time, I never lost my love for building and implementing. So the goal of this master's was to gain a theoretical understanding of humans, how they think, behave, and make decisions, and combine that with my technical expertise to create technology that genuinely serves people, not just features that ship.
Achievements
That blend has already started to take shape in my coursework. In Adaptive Interactive Systems, I helped design a recipe recommender that treats human context, such as time, skill, and available equipment, as seriously as taste, translating research on food decision-making into concrete interface metrics. In Data Visualization, I got to work at the more analytical end, implementing graph-drawing algorithms from scratch to understand how structure itself can be made legible to people. And in an empirical research project on mouse acceleration, I ran a full longitudinal study, from experiment design to statistical analysis, to test a claim about human motor learning that had previously only been anecdotal. Across all three, the pattern is the same: using rigorous, technical methods in service of a genuinely human question.
Looking Ahead
Looking ahead, I want to move into research and development roles that let me work the full cycle myself: understand what people actually need through research, then design and build the thing that addresses it, rather than handing that boundary off to someone else. The rest of this master's, including my thesis, is where I want to keep sharpening that loop: research methods sharp enough to trust, and technical skills strong enough to act on what that research reveals.
Skills & Knowledge
User Research
Designing studies that actually answer the question you're asking, from framing a research question and choosing a design, to running it with real participants. Practiced across a longitudinal experiment on mouse acceleration and a layered evaluation plan for an adaptive recipe recommender.
Quantitative Analysis
Analyzing behavioral data with statistical rigor, comfortable going beyond a simple t-test. Ran linear mixed-effects models with multiple-comparison correction in Python to test whether disabling mouse acceleration improved pointing performance over time.
Qualitative Analysis
Interpreting non-numerical signals, from expert heuristic evaluations to open-ended feedback, to judge whether a design decision actually holds up. Used to validate interaction-interpretation rules for a recipe recommender's user model.
Implementation
Turning a design or research idea into a working product, not just a mockup. Built full task batteries, dashboards, and client websites end-to-end in Svelte, Next.js, and TypeScript.
Recommender System Design
Designing recommendation algorithms that balance accuracy with real user context. Proposed a hybrid content-based and collaborative-filtering model that factors in cooking skill, time, and equipment, not just taste.